
DemandFlow® Workbooks
Analysis that runs on your live network, not on a copy of it.
Query sites, circuits, links, fibre, devices and services in standard SQL, or ask in plain English. Join them with vendor reports and billing files. When the analysis finds a record that is wrong, fix it from the grid, under approval, with an audit trail. One source of truth, with the analysis built in.
The Challenge
Every planning question starts with an export
Most network teams answer capacity, risk and cost questions by exporting inventory into spreadsheets. By the time anyone reads the result, the network has moved on. Analysts spend their week maintaining extracts, and when the analysis finds a record that is wrong, the correction stays in someone’s spreadsheet instead of reaching the inventory.

Out of date on arrival
An extract is a snapshot. Decisions get made on figures that stopped being true the day they were exported.

A ticket to the data team
Planners and managers wait for an analyst to write the query. Simple questions take days.

Findings that never fix anything
The analysis spots the gap, the duplicate or the wrong port count. The inventory stays exactly as it was.
Live inventory
Every record is a table
Workbooks runs inside DemandFlow®, on the same records the network is run from. There are no exports, no ETL and no separate data warehouse to set up. Every answer comes from the inventory operations already trusts.

Queried directly
Sites, circuits, links, fibre, devices and services are available as tables the moment a workbook opens.

One language for every format
Join live records with uploaded Excel, CSV, Parquet and JSON files up to 2 GB, all in standard SQL.

Small and large
Most work runs instantly in the browser. Larger queries move to a server engine with paged results.
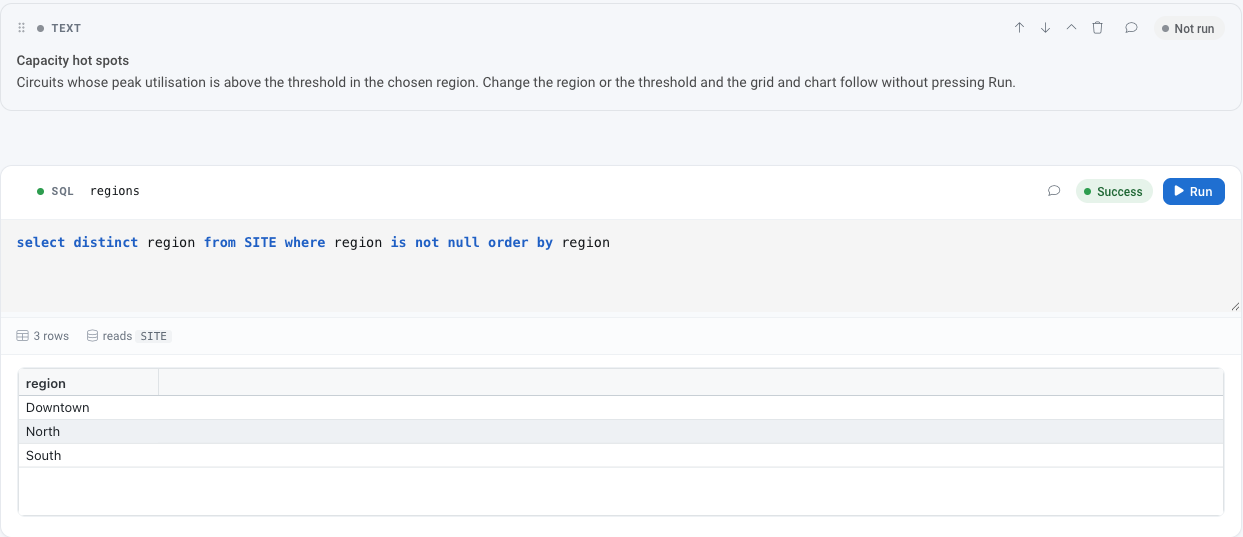
A SQL cell reading the live SITE records, with the result grid beneath it.
Ask in plain English
Analysts write SQL. Everyone else just asks.
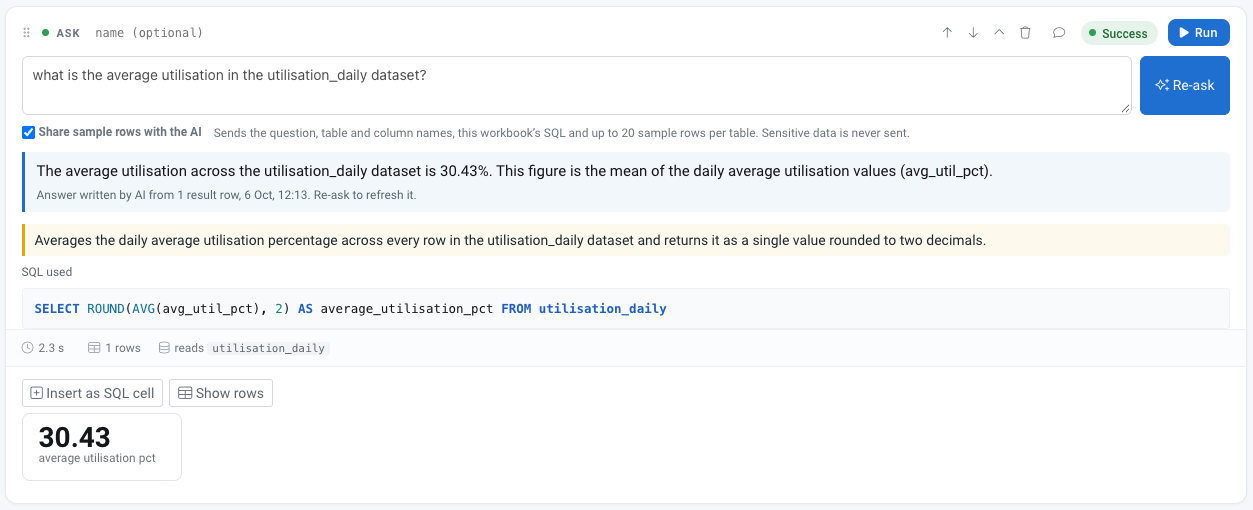
A planner types a question and gets the SQL and a short written answer. Every answer shows the query behind it, so it can be checked rather than taken on trust. Analysts work in standard SQL with no proprietary language to learn, and are productive on day one.
- Plain English questions return the SQL and a written answer
- AI is opt in per customer
- Datasets marked sensitive are never sent to the model
A plain English question, the written answer, what the query does and the SQL behind it.
Reactive analysis
Change one input and everything updates
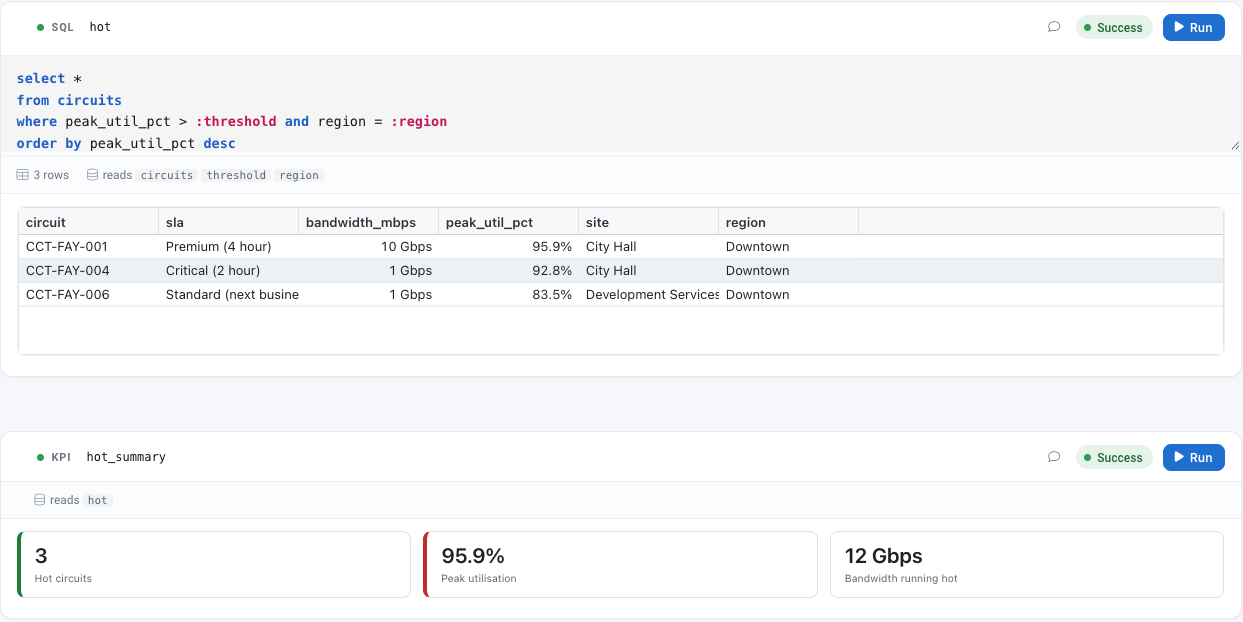
A workbook is built from cells: text, inputs, SQL, grids, charts and KPI tiles. Change a region or a threshold and every result, chart and tile that depends on it updates together, so one workbook answers the question for every region rather than one.

Inputs drive the queries
Region, threshold and date inputs feed straight into the SQL beneath them.

Grids, charts and KPI tiles
Results shown the way the question needs them, side by side in one document.

Network aware
Data types for circuits, bandwidth, utilisation, fibre strands, splices and ODF ports, not a generic dashboard builder.
Circuits above the threshold in the chosen region, with KPI tiles that update when either input changes.
Governed edits
The analysis can fix the data
When a workbook shows that a record needs updating, the change is made straight from the grid. It is staged, approved, checked for conflicts and recorded in an audit trail, so the inventory stays the trusted source instead of drifting away from the analysis.

Staged and approved
Corrections wait for approval before they reach the live record.

Checked for conflicts
An edit that clashes with a newer change to the same record is caught, not silently overwritten.

Who, what, when and why
Every change is recorded, which is the audit evidence resilience and compliance teams ask for.
Ready-made templates
Start from the questions networks actually ask
Templates for the analysis network, OSP and operations teams run every week, ready to open on your own data and adapt.
- Capacity hot spots: which sites and links run out first
- Shared risk and shared risk by strand
- Fault triage
- Fibre utilisation
- Closure and chamber capacity
- ODF port utilisation
- Splice and test loss outliers
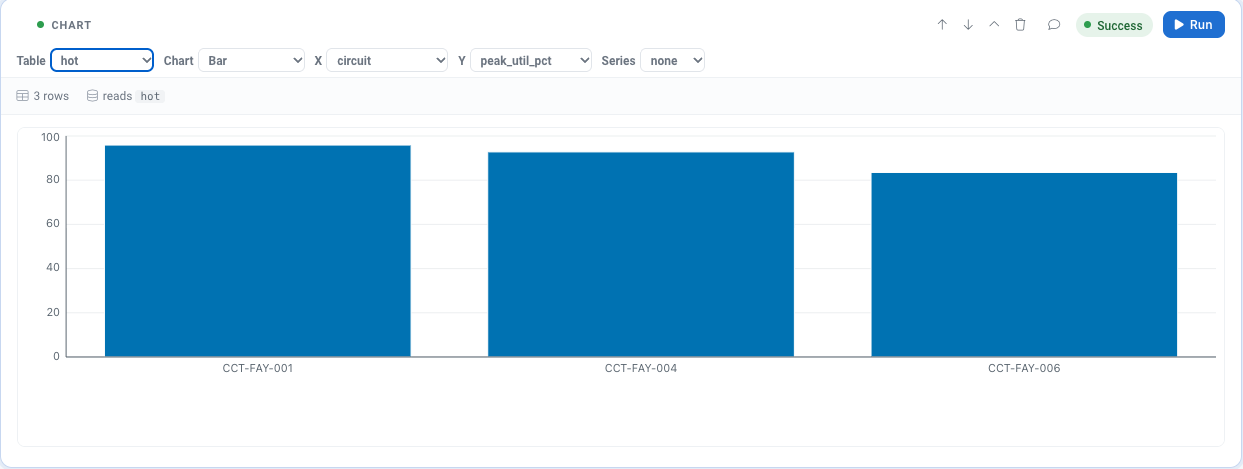
The capacity hot spots template charting the hottest circuits by peak utilisation.
Reports that build themselves
Scheduled, shared and ready for the review meeting
A workbook can rerun daily or weekly, keep a dated snapshot of every run and tell its subscribers by email and in app when a run completes or fails. The weekly picture arrives on its own.

Built for teams
Share as viewer, runner or editor. Comment on cells, rows and columns. Restore any earlier version in one click.

Present it
Presentation mode for review meetings, with a redaction switch that masks sensitive columns for screen sharing.

Take it with you
Export to Excel, CSV and PDF when a result needs to leave the platform.
Who uses it
From the capacity planner to the CTO
Workbooks puts trusted figures in front of everyone who makes decisions about the network, without waiting on an analyst.
- Network planning managers and capacity planners: hot spots, growth forecasts, what runs out first
- Network and OSP engineers: fibre utilisation, closure and port capacity, splice and test loss outliers
- NOC and operations managers: fault triage, recurring reports, the weekly picture
- Inventory and data quality managers: gaps against vendor and field data, corrected under approval
- Commercial, procurement and finance analysts: vendor bills reconciled against services in use
- Resilience, risk and compliance leads: shared risk, route diversity and evidence of every change
- Heads of network and CTOs: trusted figures for investment decisions
What changes
Answers in minutes, without an export
- One set of numbers everyone trusts
- An inventory that stays accurate as the network changes
- Recurring reports that build themselves and arrive on schedule
- Overbilling and unused services found by checking vendor files against the inventory
- Fewer separate tools, spreadsheets and email chains
- Safe screen sharing with sensitive columns masked
Built for every kind of network
Mobile operators running RAN and transport, fixed and IP network operators, fibre altnets and FTTx builders, wholesale, dark fibre and DWDM providers, ISPs, data centre operators, utilities, rail and transport networks, managed service providers and integrators, and public sector and campus networks. Book a demo and see Workbooks run on your own inventory.
One Platform. Strategy to Stack.
Ready to Take Control?
Join the leading companies who have transformed their technology management with DemandFlow®.
Book a personalised demo today.