
ESG and Carbon
Find the kit you can safely switch off. Prove it. Remove it.
Every network and data centre carries servers, storage and racks that do nothing but draw power. DemandFlow® finds the devices at a site that are measured idle, excludes anything whose role or owner is not proven, ranks what is left by the money it costs each month and the carbon it emits each year, and puts the evidence on every line. A named approver signs it off, and DemandFlow raises the change, the decommission work order and the disposal order to make it happen.
The Challenge
Everyone knows the idle kit is there. Nobody will switch it off.
Servers that have not seen traffic in months. Arrays idling at one per cent CPU. Racks powered for workloads that moved years ago. The estate is paying for it in energy, maintenance, lease and colocation charges, and reporting it as carbon. It stays because nobody can prove a device is safe to remove, nobody can say what it costs, and nobody owns the work to take it out.

No proof it is safe
A device might be a DR standby, might belong to a team that still needs it, might be in the middle of a lifecycle. Without a rule that tests those things, the safe answer is to leave it.

No figure for the cost
Depreciation, maintenance, lease, colocation and power sit in different systems. Without a monthly figure per device, there is no case to put in front of anyone.

No path to the work
Even an agreed list needs a change, a work order for the field team and a disposal order with its certificate. When those are raised by hand, the list waits.
Safe reclaim
Candidates found by measurement, excluded by rule, ranked by money and carbon
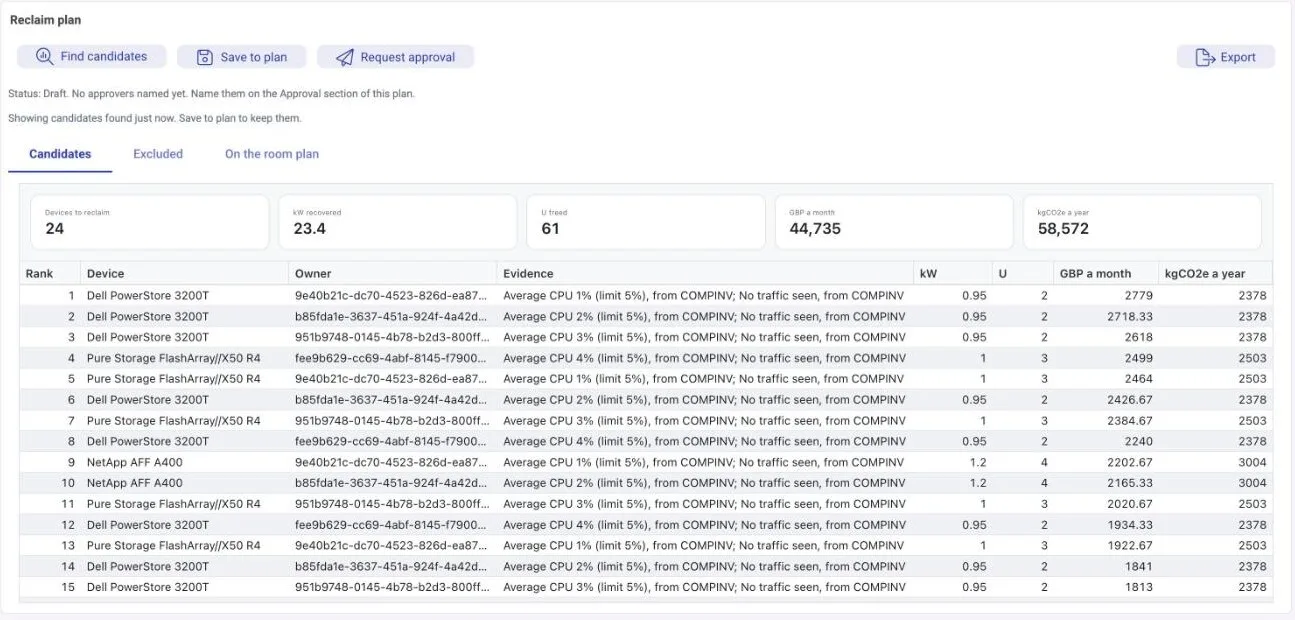
A reclaim plan belongs to a site. Find candidates loads every asset at the site with its catalogue entry, rack and site record. A device counts as idle only on measurement: average CPU below 5 per cent, or traffic in plus out below 1 Mbps, or no traffic seen, over 30 days. A device with no readings is never proposed. Before the idle test, three rules remove anything that is not proven safe: a DR role that is not recorded as production, no owning department and no business owner, or a lifecycle that is not Live. What is left is ranked by GBP a month, then kgCO2e a year, then kW, with the evidence on every line.
- Monthly cost per device from price over useful life, annual maintenance, lease and colocation charges
- kW from catalogue power, scaled by the rack’s measured draw against its allocated draw
- Operational carbon as kW x 8,760 hours x the site’s PUE x the site’s grid factor; embodied carbon held once on the catalogue entry
- A KPI strip of devices to reclaim, kW recovered, U freed, GBP a month and kgCO2e a year
Excluded, openly
A role that is not proven is not safe
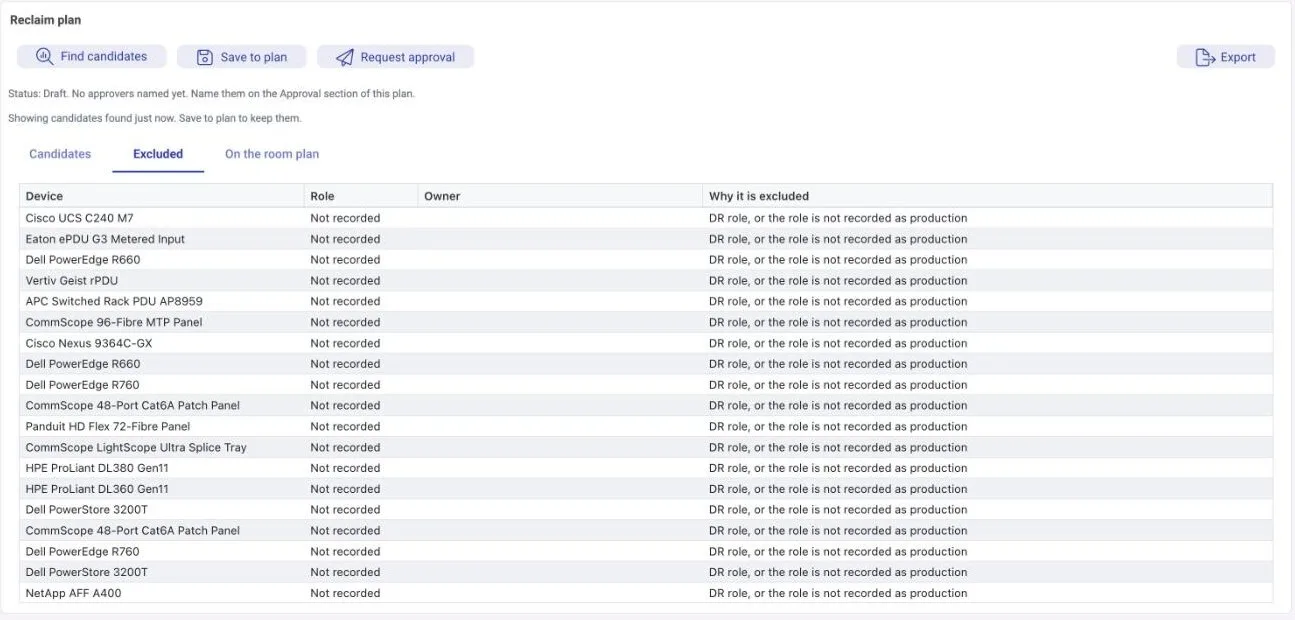
Every device the rules leave out appears on the Excluded tab with its reason: a DR role, or a role not recorded as production; no owning department and no business owner; or a lifecycle other than Live. The capacity manager sees exactly which records need completing before more of the estate becomes reclaimable, and the approver sees that nothing has been quietly dropped.
On the room plan
See where the savings are, rack by rack
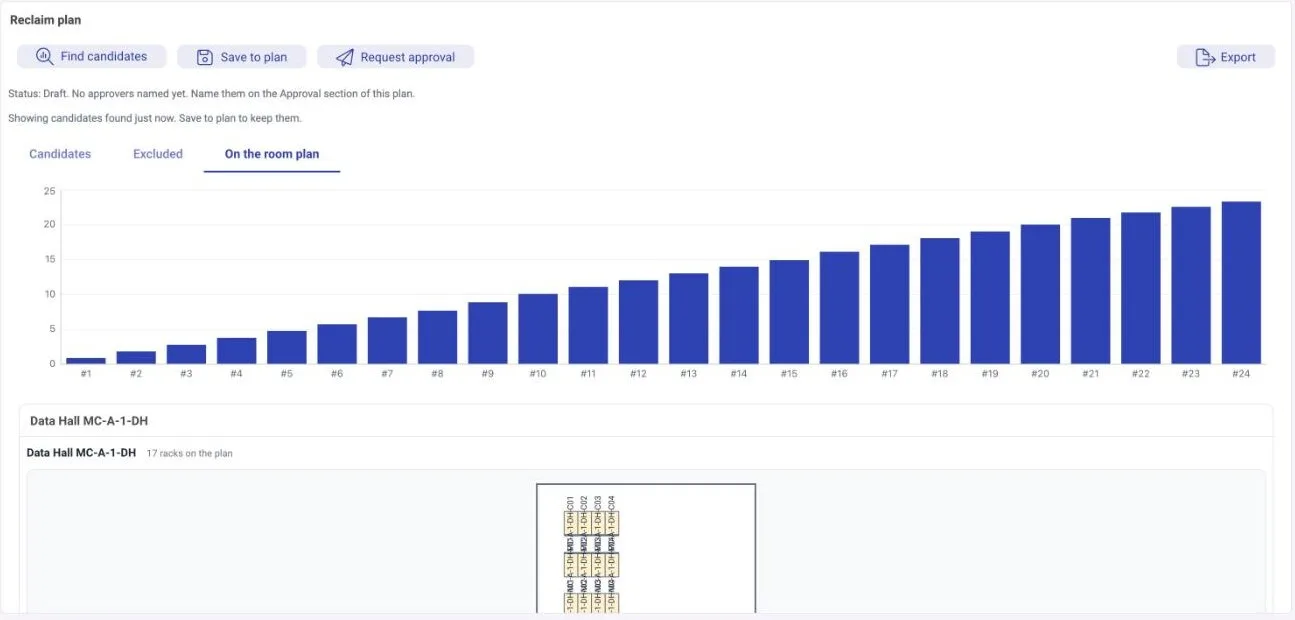
The room plan tab marks the candidate racks on the data hall plan and warns where a rack holds both a candidate and DR or unattributed kit. A cumulative kW chart by rank shows how far down the list the worthwhile savings run. For every Live rack DemandFlow also reports stranded kW and U, valued at the site’s GBP per kW year and GBP per U month, rolled up to the room and the site.
Approve, then raise the work
A named approval, then the change, the work order and the disposal order in one step
Save to plan writes the candidates as reclaim items with their owner, DR role, kW, U, cost, carbon, evidence and rank. Request approval needs named approvers, and only a named approver can approve or reject. Until the plan is approved, with the approver and the time recorded, DemandFlow refuses to raise any work. On approval, one step raises a draft network change on the site, a decommission work order with an item per device, and a disposition order with a line per device carrying its avoided carbon.
- Avoided carbon is embodied kgCO2e x the route factor: reuse 1.0, refurbish 0.8, recycle 0.2, landfill 0, with tenant overrides
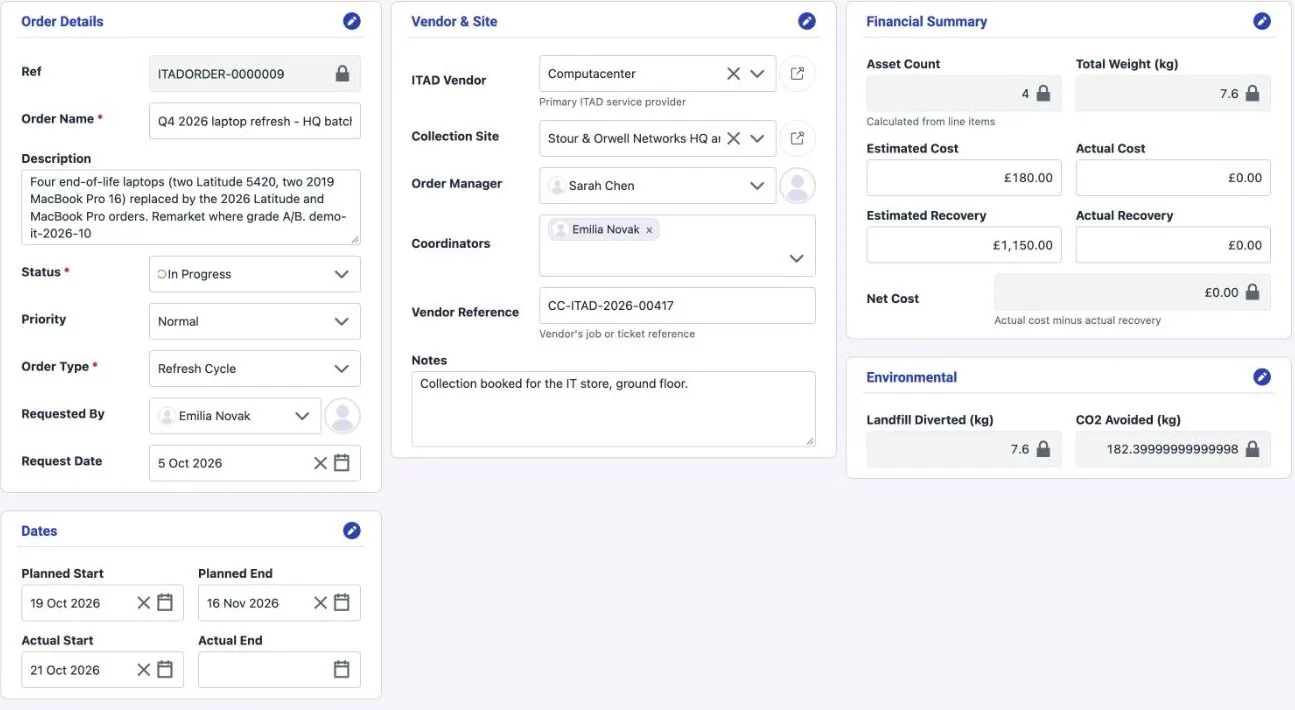
- A completed disposition line marks the asset resold or recycled and disposed certified; the order totals weight, landfill diverted and CO2 avoided
- The plan keeps a reference to the change and the disposal order it raised, so the trail runs from the idle reading to the certificate
- Items already raised or excluded are skipped, so the step can be run again safely; rows export for your own change process
The estate in view
Ghost servers, zombie ports and the monthly waste, across every site
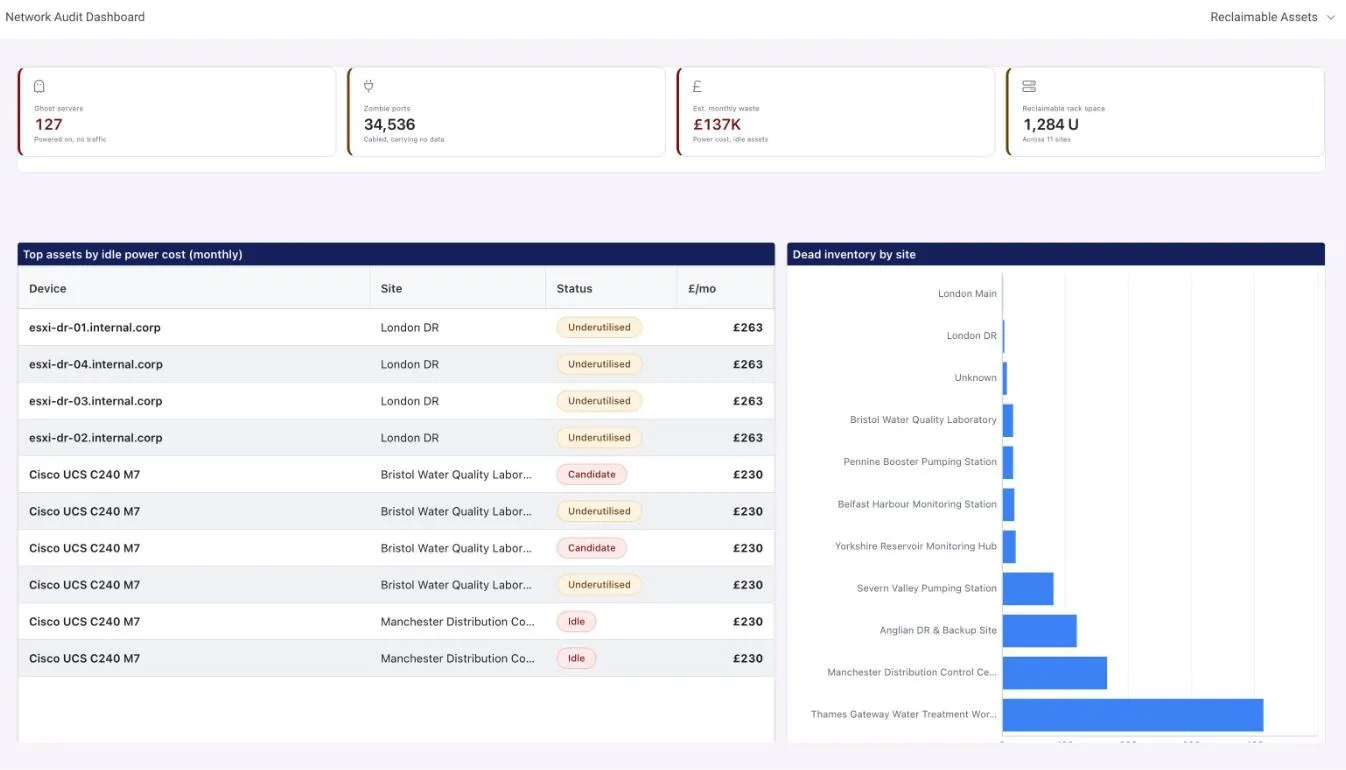
The network audit dashboard reads the whole estate in four views. Reclaimable Assets counts ghost servers and zombie ports, estimates monthly waste from idle power, totals reclaimable rack space, lists the top ten idle assets by idle power cost and charts dead inventory by site. Lifecycle Runway shows end of life now, end of support within six months, contracts expiring within twelve and a refresh budget signal. Power and Sustainability shows estate draw, idle draw, the annual footprint in tCO2e and avoidable emissions. ITAD Pipeline follows assets through disposal.
Asset efficiency
The waste opportunity in money, not just counts
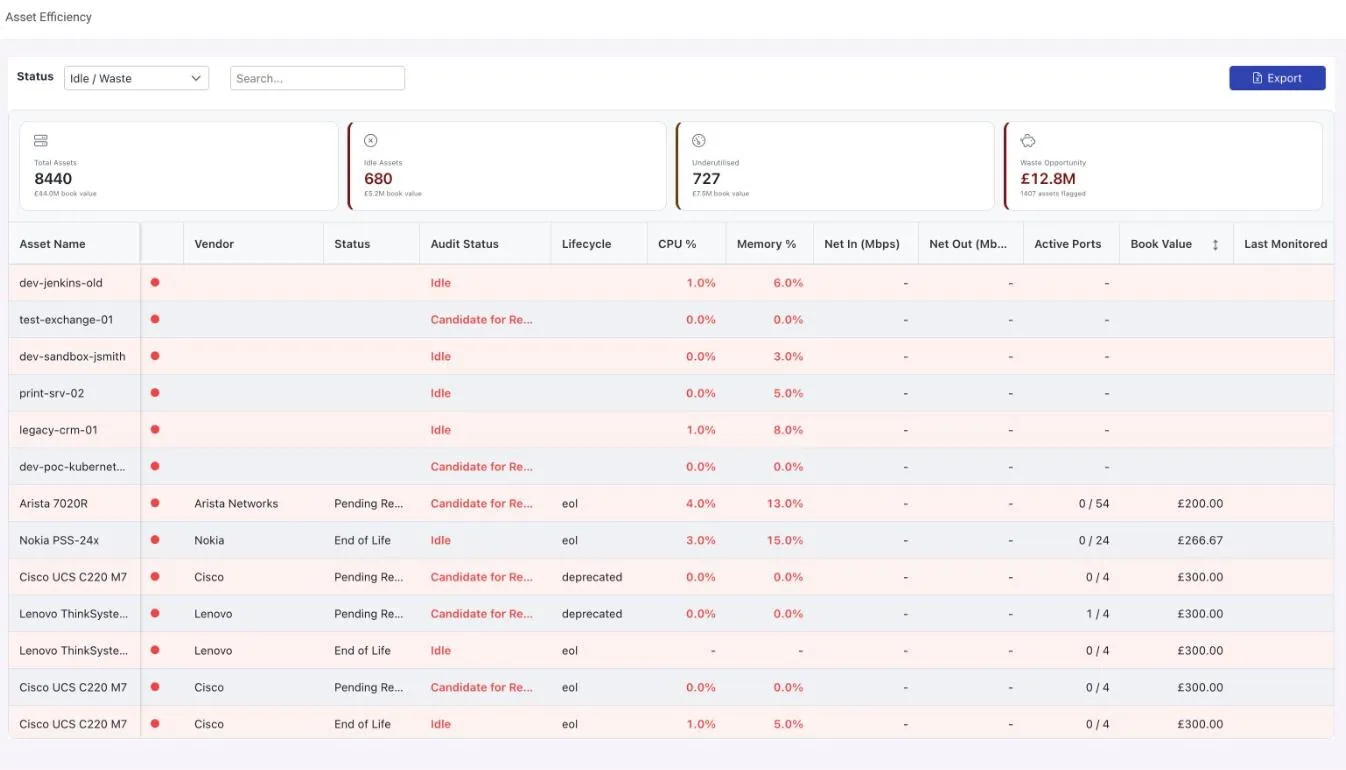
Asset efficiency lists every asset with its latest monitoring snapshot: CPU, memory, network in and out, active ports, book value and when it was last monitored. The KPI strip totals assets, idle and underutilised, each with its book value, so the FinOps lead sees the opportunity in pounds. Filters narrow the grid to Idle / Waste or Underutilised, and colour bands make the list read at a glance. The audit status, traffic, CPU, DR role, owner and lifecycle it shows are the same fields the reclaim engine tests, so what the dashboard shows is what the plan will find.
Carbon accounting
Sites, energy, tenants, services, materials and people, from one factor table

Factors and sites
One table of carbon factors by category, scope, unit, effective year and source (DESNZ, DEFRA, IPCC, manufacturer or custom). Every site carries PUE, grid factor, cost per kWh, annual energy, Scope 2 and renewable percentage, with a Cost and carbon panel of tiles, carbon by rack and the top devices by operational carbon.

Energy and tenants
Readings per site per period hold grid kWh, generator litres, solar kWh and cost. Carbon follows the grid and fuel factors; solar carries none. Allocate to tenants splits a reading by the power system’s rule, measured, by equipment rating or fixed share, and raises a proposed recharge per tenancy.

Services, projects and people
Device carbon shared across the network services it carries, stored per service with a top twenty chart. Project materials as Scope 3 and plant as Scope 1. Carbon profiles by working pattern, summing to kgCO2e a day, linked to the billable resources they describe.
What changes
Idle kit leaves the estate with the evidence, the approval and the certificate behind it
- Reclaim candidates proposed only on measured evidence and only where the role, owner and lifecycle are proven
- A monthly cost and an annual carbon figure on every device, rack, room and site, from one set of rules
- A named approval before any work, with the approver and time on the record
- The network change, decommission work order and disposition order raised in one step, with avoided carbon per line
- Energy and emissions per site, recharged to the tenants who share it, exported in ESG rows
- An Emissions by site workbook by region, with a high emitter threshold and the sites with missing figures listed
One Platform. Strategy to Stack.
Ready to Take Control?
Join the leading companies who have transformed their technology management with DemandFlow®.
Book a personalised demo today.